Web Reader on Membrane Biophysics -
Part III
go to Part I / Part II
Table of contents
III Membrane transport
7. Transport processes
Equilibrium potential
8. Functional membrane protein reconstitution
Membrane vesicles
Planar lipid membranes
9. Single molecule behavior
Electrophysiology techniques
Macroscopic current recordings; ligand gated
receptors
Single channel recordings in planar lipid bilayers
7. Transport processes
(see chapter 14 in vanHolde)
Equilibrium potential
Ion flux across membrane channels can be theoretically understood using thermodynamic
quantities describing a flow J which is a function of the solute concentration
times the velocity or mobility of the solute in solution. This relationship
is strictly true only for dilute, ideal solutions where there are no interactions
between solute molecules. The essential question in transport processes is that
about the driving force. What makes solutes move across membranes.
Obviously, thermal motion is always given, but operates in a random fashion
with respect to direction. However, in a concentration gradient, movement of
ions follows the direction from the high to the low concentration (end state
has higher entropy). This process is called diffusion, the driving potential
is the chemical potential of the solution(s), the flow is that of molecules
and/or ions, and the equilibrium state is reached when the system obtaines a
uniformely distributed chemical potential. Diffusion is an essential component
of ion flow across ion channels, because the channels themselves cannot exert
any force onto the mobile ions. Channels promote passive diffusion in their
open state (conformation) and inhibit diffusion when they are closed (conformation).
Charged molecules (ions) experience an additional force in an electric field.
The process of ion mobility is called electrical conduction, the driving
force the electrostatic potential, the flow is that of ions, and the state of
equilibrium is reached when the electrostatic potential (field strength) is
uniform (note that this does not mean necessarily zero potential, but describes
a state of no acceleration of particle, i.e., constant velocity.) A membrane
potential of course represents an electrostatic potential and thus is the second
important driving force of ions across ion channels. Ions can be forced to move
through a channel in the absence of an ion gradient (no chemical potential)
or even against their concentration gradient (uphill movememnt).
The combination of both chemical potential and electrostatic potential completely
describes the driving force an ion experiences and causes ion flow across membranes.
The process is called electrophoresis, the potential the electrochemical
potential, the flow is that of ions, and the state of equilibrium is reached
at a uniform electrochemical potential.
Passive transport of ions across membranes driven by the chemical potential
can generally be described by the following equation with a distribution of
a solute i with 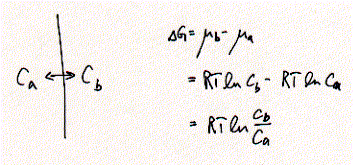 concentrations Ca and Cb corresonding to side a and b of the membrane,
respectively. The process is spontaneous for solute flow to the right side if
concentration Cb is smaller than concentration Ca. DG <0 and the process is at equilibrium when the concentration
gradient is zero, i.e., Ca = Cb, with DG=0. This general equation can be adapted to situations suitable
for electrophysiology experiments, where we usually have to deal with at least
two ion species, e.g., NaCl is solubilized as Na+ and Cl- ions. For ion channels,
this is important because they usually exhibit an ion selectivity meaning that
the flow of Na+ across the membrane is separated from the flow of Cl- ions.
This results in the separation of charges across biological membranes and the
formation of electrochemical potentials which can be exploited by cells through
the selective activation and inactivation of distinct ion selective channels
at any given moment.
concentrations Ca and Cb corresonding to side a and b of the membrane,
respectively. The process is spontaneous for solute flow to the right side if
concentration Cb is smaller than concentration Ca. DG <0 and the process is at equilibrium when the concentration
gradient is zero, i.e., Ca = Cb, with DG=0. This general equation can be adapted to situations suitable
for electrophysiology experiments, where we usually have to deal with at least
two ion species, e.g., NaCl is solubilized as Na+ and Cl- ions. For ion channels,
this is important because they usually exhibit an ion selectivity meaning that
the flow of Na+ across the membrane is separated from the flow of Cl- ions.
This results in the separation of charges across biological membranes and the
formation of electrochemical potentials which can be exploited by cells through
the selective activation and inactivation of distinct ion selective channels
at any given moment.
For an electrochemical potential the total free energy is the free energy of
the chemical potential plus the free energy of the Nernst potential:
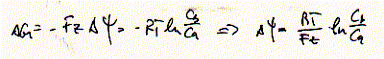
which defines the relationship between the chemical potential and electrical
potential DY at equilibrium for an ion species with
concentrations Cb and Ca, and charge z.
The Nernst potential is also called the reversal potential Erev
where the net current across the membrane is zero. Note that although the net
current is zero, there is constant flow of ions across the channel. The equilibrium
is reached because the chemical potential and the electrical potential are driving
forces of opposite sign, but equal strength. If one of the two is changed (DV
or ion concentrations change) the system will no longer be at equilibrium and
a current can be measured. If given enough time, the system will reach a new
equilibrium.
There is rarely a situation in real cell where there is only one ionic species
present. In minimum there are two (Na+ and Cl-) and normally more than two (Na+
and K+ and Cl-) etc.. A more general equation describing the equilibrium situation
for multi ion systems is given by the Goldman-Hodgkin-Katz (GHK) voltage equation:
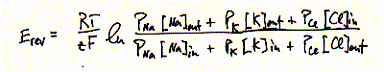
This GHK equation describes the equilibrium or reversal potential for a membrane
which is permeable for Na+, K+, and Cl- ions. These three permeabilities are
of course promoted by the presence of ion selective channels; one type for Na+
ions (voltage gated Na-channel), one type for K+ ions (voltage gated K-channel;
see Shaker K-channel above), and one type for Cl- ions (voltage gated or pressure
sensitive or Ca++ sensitive or a combination of all). In simple systems, where
only the ion selectivity of a cation selective channel needs to be determined,
Cl- flow does not contribute to the equilibrium potential, and the permeability
ratios of P(Na+) over P(K+) can be determined. Note that only relative permeabilies
(ratios) can be measured, and not absolute flux rates by the GHK voltage equation.
Furhter note that the GHK equation allows the determindation of ion selectivities.
Finally, if only a K+ selective channel is open, i.e., a potassium selective
membrane, only potassium ions contribute to the equilibrium potential of this
membrane (because all other ions are impermeable). Since K+ are found at high
concentrations inside, they will flow to the outside along their chemical potential
or ion gradient, but will be 'pulled back' by the increasing negative side of
the cytoplasmic membrane surface, due to the loss of positive charges (K+) flowing
from inside to outside. It can be said that the Nernst potential of K+
determined the resting potential of a cellmembrane.
8. Functional membrane protein reconstitution
Membrane vesicles
To study the function of membrane proteins, they need to be in a membrane or
phospholipid bilayer. Their are two types of artificial bilayer types -- spherical
and planar. The first are referred to as vesicles or liposomes and the latter
as planar lipid bilayer or black lipid membranes (BLM). Vesicles contain a lumenal
aqueous compartment which is separated by the membrane. Membrane proteins incorporated
into vesicle membranes, therefore, can be studied for transport processes.
Vesicles come in two forms -- unilamellar and multilamellar. Only the unilamellar
vesicles are of interest here because they contain exactly one single membrane,
where as the other types contain multiple layers and are not suitable for membrane
transport studies.
Fig. Unilamellar und multilamellar membrane vesicles
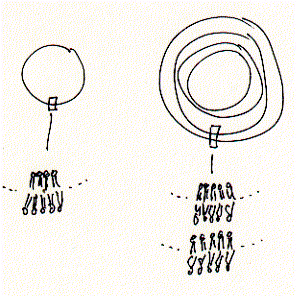
Unilamellar vesicles belong to two categories, small vesicle called SUV, and
larger vesicle called LUV. Small unilamellar vesicle have a diameter which is
usually smaller than 200nm. It is these kind of SUVs that are the preferred
vesicle species used for transport studies, and as we will see later, for the
formation of planar lipid bilayers.
The formation of vesicles is achieved by a few widely used techniques:
- sonication
- freeze-thaw cycles
- detergent dialysis
While the first two techniques are fairly rapid (several minutes), detergent
dialysis requires several hours or days depending on the detergent type, i.e.,
CMC value. Sonication makes use of high energy ultra-sound water bath preparations.
The sample, a phospholipid water solution is put in the center of a sonication
chamber. The lipid solution quickly turns translucent indicating the formation
of vesicles. The clearer the solution (see light scattering), the smaller the
particles in solution. It depends on the protein used for reconstiution if sonication
is an appropriate method. Often, larger vesicle fragments are decreased in their
size by brief pulses of ultra sound sonication.
Freeze-thawing of lipid solutions makes use of the phase behavior of phospholipid
layers. Freezing induces crystalline layers which can break into smaller fragments.
These fragments start to form vesicular structure after repetitive freezing
and thawing of the lipid solution. The advantage of both sonication and freeze-thawing
is the absence of detergents at any time during the procedure. Native membrane
fractions can thus be reduced in size on isolated as SUV preparations.
Detergent dialysis is the method of choice for complete control of vesicle
type (SUV) and composition. Here, membrane proteins and phospholipids are solubilized
in detergent extracts  in
the form of mixed micelles. Placing the detergant extract solution into a small
volume dialysis bag, which in turn is placed into a large volume of buffer (no
detergent, no lipids, no proteins), the free monomeric detergent will slowly
diffuse into the large volume, while micelles are too big to cross the porous
material of the dialysis membrane. The phospholipids will be retained inside
the dialysis bag because their CMC value is severla orders of magnitude lower
than the CMC of the detergent. Hence the removal rate of phospholipid monomers
is so slow that it can be neglected over the duration of the dialysis. When
the detergent concentration inside the
in
the form of mixed micelles. Placing the detergant extract solution into a small
volume dialysis bag, which in turn is placed into a large volume of buffer (no
detergent, no lipids, no proteins), the free monomeric detergent will slowly
diffuse into the large volume, while micelles are too big to cross the porous
material of the dialysis membrane. The phospholipids will be retained inside
the dialysis bag because their CMC value is severla orders of magnitude lower
than the CMC of the detergent. Hence the removal rate of phospholipid monomers
is so slow that it can be neglected over the duration of the dialysis. When
the detergent concentration inside the  dialysis
bag reaches the CMC value or drops below it, the phospholipids, together with
the proteins, will assemble into SUV structures. Depending on the protein, they
are oriented asymmetrically (triangle indicates structural asymmetry; arrow
indicates functional asymmetry, i.e., active transport in one direction such
as for proton pumps bacteriorhodopsin or H-ATPase; ion flux through ion channels
has no intrinsic asymmetry) or are found in a 50-50 or random orientation. Adjusting
the lipid-protein ratio before dialysis, the number of proteins per SUV can
be estimated, allowing for the control of membrane protein assembly.
dialysis
bag reaches the CMC value or drops below it, the phospholipids, together with
the proteins, will assemble into SUV structures. Depending on the protein, they
are oriented asymmetrically (triangle indicates structural asymmetry; arrow
indicates functional asymmetry, i.e., active transport in one direction such
as for proton pumps bacteriorhodopsin or H-ATPase; ion flux through ion channels
has no intrinsic asymmetry) or are found in a 50-50 or random orientation. Adjusting
the lipid-protein ratio before dialysis, the number of proteins per SUV can
be estimated, allowing for the control of membrane protein assembly.
Large unilamellar vesicle are used for electron microscopy studies. If the
lipid-protein ratio is very low (as low as 1:1 molar ratio), regular 2-D structure
are obtained suitable for electron diffraction studies. The regularity of these
protein sheets can be enhanced by further removing lipids using very carefully
controlled detergent extrection of residual phosopholipids (a process called
delipidation).
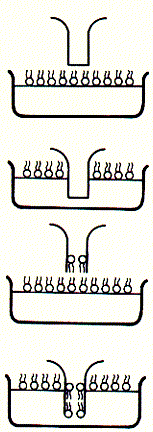
Planar lipid membranes
Planar lipid bilayers have been developed for the sole purpose of studying
ion channels in a very simple system and with as few components as possible.
Planar bilayers allow a choice of lipids, lipid composition, membrane protein,
protein orientation, and easy adjustment of electrolyte conditions on each side
of the bilayer and total control over the transmembrane potential.
The basic setup for bilayer fomation as developed by Maurice Montal (UCSD)
and enhanced to a solvent free system by Hansgeorg Schindler (University of
Linz, Austria) is shown below:
Fig. Planar lipid bilayer formation from monolayer assembly
from H. Schindler, 1980, FEBS Letters 122:77-79
A teflon two-chamber module is filled with vesicle solution and separated above
the water levels of these solutions by a thin teflon foil or septum (12mm)
which contains a single aperture with a diameter between 50 - 300mm.
Fig. Teflon septum 'sandwich'
The inner circle (light yellow) represents the 12mm
teflon foil and contains a punctured aperture of 100mm
(not visible in this picture). The central thin foil (yellow) is stabilized
between two circular sheets of thick teflon foils (light gray) that each contain
a cutout circle of about 3-5mm exposing a small area of the thin foil. Note
that the thickness of a bilayer is 50nm and thus about 240 times thinner than
the supporting thin foil.
Read
more on how to make a cell membrane!
Monolayers will spontaneously assemble from vesicles in solution. Alternatively,
a hexane/lipid droplet can be place onto each half cell solution. While hexane
quickly evaporates, phospholipids will form stable monolayers that show an liquid
phase L2 surface-pressure area behavior. A few minutes after placing the vesicle
solution into the teflon chamber, monolayers are stable enough and will form
a bilayer across the small aperture in the teflon foil separating the two half
chambers when the two solutions are carefully rised above the septum aperture.
The monolayers formed from SUV solutions are in equilibrium with the vesicles.
The surface pressure, called equilibrium pressure pe, of the monolayer
thus formed is a function of the SUV diameter.
Fig. Correlation between SUV diameter and monolayer surface pressure
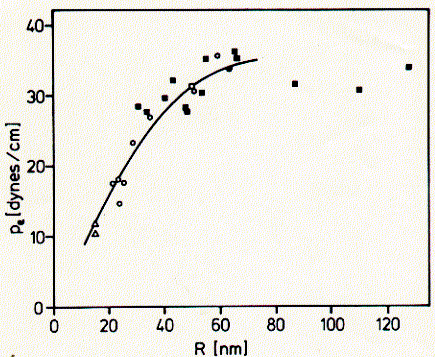
from H. Schindler, 1980, FEBS Letters 122:77-79
Proteins can be inserted into the membrane before or after bilayer formation.
The figure on bilayer formation shows that proteins are already incorporated
into the vesicle membranes. This means that membrane proteins that will be part
of the newly formed bilayer structure will temporarily be inserted at the air-water
(or teflon-water) interface and are susceptible to denaturation. The use of
this technique, however, demonstrated that many membrane proteins reconstituted
from vesicles into planar membranes are functional, although these studies are
not quantitative and the observed activity is focussed on a very small number
of active proteins only, usually in the range of one to less than one hundred.
The goal of these membrane electrophysiology studies in most cases are so called
single channel recordings, which depend on the presence of only one single channel
protein complex.
Monolayer experiments can show the degree of protein deanturation of membrane
proteins at the air water interface. As discussed earlier, p-A
isotherms are obtained under equilibrium conditions and the path of the isotherm
is thus independent of the direction of the change in surface area. Monolayer
containing membrane proteins, such as native membrane vesicle preparations often
show non-reversible isotherm behavior.
Fig. p-A isotherms from postsynaptic vesicles
(contain nicotinic acetylcholine receptors)
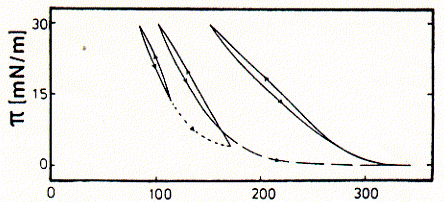
from Schuerholz and Schindler, 1991, Eur.Biophys.J. 20:71-78
The figure shows that repetitive compression relaxation of surface area results
in increasing minimal area/molecule values. The first isotherm obtained shows
a minimal A value of about 150Å2, the second of about 200Å2,
and the third cycle shows a minimial A value of about 300Å2. This
increase can clearly be attributed to the denaturation of proteins at the interface.
It can be shown, however, that keeping a minimal surface pressure above 15mN/m
inhibits the denaturation of most membrane proteins, including the nicotinic
acetylcholine receptor shown above (simply stay within the cyclic isotherm on
the very left). Since the equilibrium pressure of the vesicles used for bilayer
formation is around 30mN/m, this reconstitution technique provides a safe and
solvent free way of incorporating membrane proteins into planer lipid membrane
systems.
Alternatively, planar membranes can be formed from pure lipid vesicles only
and membrane proteins are incorporated after bilayer formation by either vesicle
fusion or addition of detergent extracts to one side of the bilayer. The latter
is a suitable method when using mild, non ionic detergents like Triton X-100
or beta-octyl glucoside at concentrations right above their CMC value. This
keeps the membrane proteins soluble, and after adding a few microliters of detergent/protein
extracts to the 1ml volume of these membrane system, the detergent is instantly
diluted far below its CMC value and spontaneous incorporation of membrane proteins
can be observed. These detergents at concentrations below the CMC do not destabolize
plananr bilayers nor do they induce channel like pores that intefere with ion
channel measurements.
The formation of these bilayers can not be monitored visually because they
are too small. The first bilayers, however, have been formed by monitoring light
refraction of a decane/lipid droplet covering the septum aperture ('painted'
membranes). The slow diffusion of the decane into bulk solution resulted in
a thinning phospholipid layer eventually forming a bilayer. The decreasing solvent
content of the droplet diminished light reflection and the black picture was
an indication of completion of membrane formation, thus the name black lipid
membranes or BLMs. This technique is still in use because it is dramatically
less challenging than the vesicle supported bilayer technique developed by H.
Schindler. The substantial residual hydrocarbon in the membrane, however, may
affect channel activity. The whole process of solvent free membrane formation
is followed by measuring decrease in impedance or increase in AC current once
the two half chambers are in contact through their respective monolayers (note
that when the bilayer breaks or does not form, the current signal is in saturation.
i.e., short circuiting the electrodes). The successful formation of a bilayer
can be seen below (left panel) when observing the increase in A/C current across
the teflon septum to a maximal level indicating that the entire aperture is
covered and the size of the membrane does no longer increase.
Fig. Bilayer formation followed electronically (AC current) and ion
channel recordings (DC current)
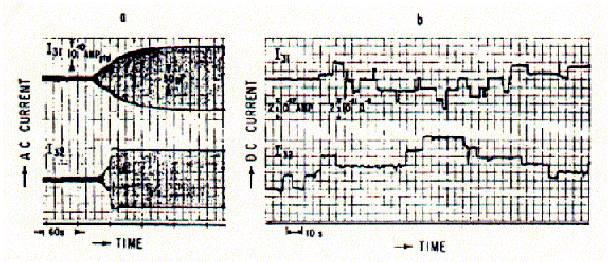
from Schindler and Feher, 1976, Biophys.J. 16:1109-1113
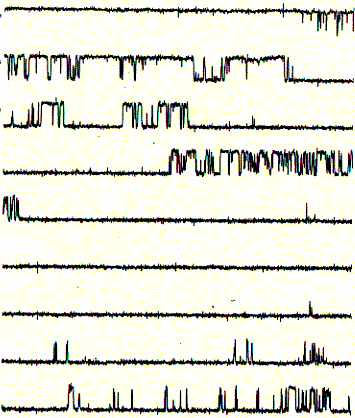
When ion channels are incorporated into the membrane, rectangular jumps in
DC currents are indicative of opening and closing transitions of ion channels.
The recording shown here were obtained from Gramicidin A peptide solutions.
9. Single molecule behavior: Electrodiffusion
through ion channels
Electrophysiology techniques
The mechanisms of drug-receptor interaction has been elucidated by combining
structural studies with electrophysiological experiments. The latter implores
the 'enzyme' kinetics of ion channels and with the development of patch clamp
technique provides an extremely sensitive monitoring assay down to the level of
a single active receptor unit.
Electrophysiology assess the transport rates of ions through ion channels.
This transport is measured as current, or ionic current, because ions carry
charges. Thus, the flux of ions across membranes can be compared to a simple
electronic circuit composed of a ohmic resistor Rm -- the ion
channel -- in parallel to a capacitor, Cm,
-- the phospholipid bilayer, and 'battery', or transmembrane potential
Vm, due to asymmetric distribution of ions, i.e., ion gradients.
Fig. Equivalent circuit of a membrane-ion channel system
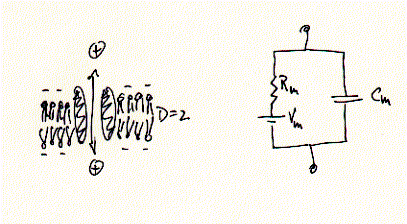
While ions (+) can pass freely across the ion channel, they are prohibited
in doing so across the los dielectric medium (D=2) of the membrane. Ion currents
can be measured in very different membrane systems. Two in vitro systems shall
be described here in more detail; the Xenopus frog oocyte voltage clamp and the
planar lipid bilayer.
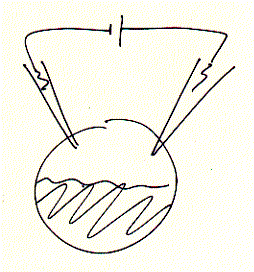
Oocyte two electrode voltage clamp
Many ion channels are difficult to isolate and purify because they are found
in small copy numbers and in membrane areas mixed with many different types of
channels and receptors. Molecular biology techniques allowed to clone and
express a desired protein in heterologous expression systems, i.e., in cells
where they are usually not expressed and under conditions where very large
quantities of the protein can be produced (over expression). An ideal system for
electrophysiology has been found in unfertilized frog oocytes. When injecting
mRNA synthesized in vitro (or extracted from cells, as mixture though) the egg
synthesizes protein from the injected mRNA template in copy numbers exceeding
manifold the concentration of endogenous levels of the same or similar types of
proteins of the oocyte itself. Thus, large signals can be generated and clearly
distinguished as being the product of the injected mRNA. Two electrode voltage
clamp assays are used to study macroscopic membrane currents. Here, two
microelectrodes are inserted into a single frog egg, with one electrode
controlling the membrane potential, while the second electrode measures the
current flowing across the entire oocyte membrane.
Fig. Xenopus oocyte two electrode voltage clamp and elicited
Na+ inward current of expressed serotonin receptor
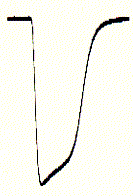
inward currents (right) are seen as downward signals (negative current;
for convention on voltage and current polarity see text), mRNA coding for the
ionotropic serotonin receptor (5HT-3A) subtype has been injected one day prior
to the voltage clamp experiments. The membrane is held constant (clamped) at
-70mV (inside negative) and 10mM serotonin (agonist)
added to the bath solution surrounding the oocyte. An immediate downward current
could be observed which shows a biphasic decay (inactivation) shortly
after;
Oocyte two electrode voltage clamp has been successfully used for many different
types of ion channels. The ease of RNA injection and the large size of the cell
makes it suitable for handling and generating a lot of data in a very short
time. 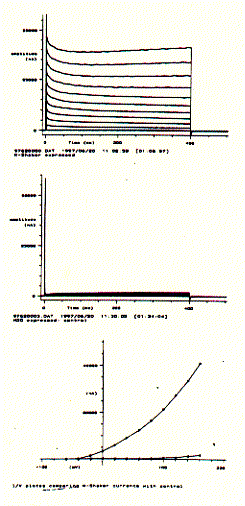 By analyzing the current amplitude and time course of the
macroscopic current as shown above as a function of membrane potential (voltage),
ion concentration, or agonist concentration and type, a detailed structure function
relationship of the expressed membrane protein (complex) will be obtained.
By analyzing the current amplitude and time course of the
macroscopic current as shown above as a function of membrane potential (voltage),
ion concentration, or agonist concentration and type, a detailed structure function
relationship of the expressed membrane protein (complex) will be obtained.
For voltage gated ion channels like neuronal potassium selective ion
channels, current recordings can be generated in 'bundles', where each current
trace corresponds to a specific voltage clamp period. By cycling through a
resting period and incremental increases in membrane potentials, current/voltage
curves can be generated demonstrating the voltage dependence of an ion channel
protein complex.
The figure to the left shows a Drosophila Shaker K-channel experiment
in a single Xenopus oocyte. The upper panel shows a bundle of macroscopic
outward current traces showing the very fast rising phase (voltage activation)
and slow and impartial decrease or inactivation. The middle panel shows the same
voltage protocol for a non-injected oocyte which subsequently does not express
any Shaker K-channel. It does, however, show a small endogenous current
component for very large, positive membrane potentials. Plotting the end
currents (bottom panel; where the voltage is switched back to its resting level
of -80mV) against the applied voltages (going from -60mV to +160mV in 20mV
increments) shows that this particular potassium channel is closed at negative
membrane potentials and can be activated (channel opens) at membrane potential
more positive than -40mV. The current/voltage diagram also shows that while the
oocyte with injected K-Shaker mRNA shows large currents at positive membrane
potentials, the non-injected cell shows a small endogenous current at voltages
above +100mV. This endogenous current, of course, contributes to the total
membrane current of injected oocytes and can be subtracted electronically, if
necessary, to extract the pure K-channel current activity.
Having established the intrinsic activity of an ion channel, agonists,
antagonists, and channel blockers can be tested for their effectiveness on
modulating channel function. Two K-channel blockers, tetraethylammonium
(TEA) and charybtotoxin (CTX) can be used to further characterize the currents
measured of 5HT-3 mRNA injected oocytes. This pharmacological profiles
unequivocally demonstrate the presence of a particular subtype of an ion channel
or receptor.
Fig. Shaker K-channel inhibition by TEA and CTX
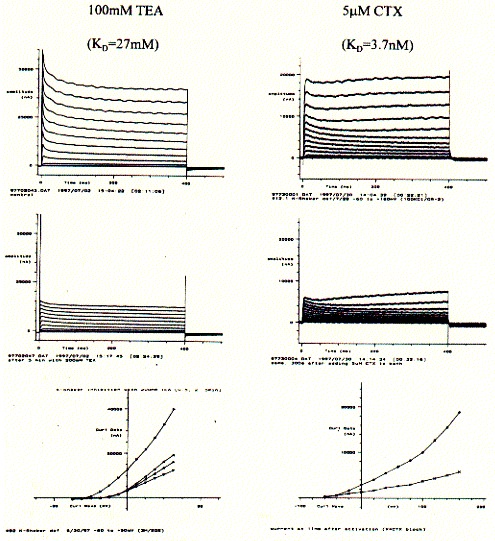
Similar to the current recordings and current/voltage curves shown for above,
the addition of K-channel specific blockers show a decrease in membrane current.
The KD numbers indicated the affinity with a lower number
representing a higher affinity of better binding of the blocker with the channel
protein. The snake venom CTX is a highly potent toxin and demonstrably
interferes with neuronal activity by selectively blocking K-channel activity.
The less potent tetraethyl ammonium salt TEA also is specific for K-channels,
but needs be applied in much higher concentration to block fifty percent of the
channel population in an experimental system (this is due to the proper
definition of the dissociation constant KD). While CTX binds to the
extracellular surface of the channel, TEA has to cross the cell membrane and is
effective only if it can bind to the cytoplasmic entrance of the pore.
Structure and Molecular Function of ligand gated receptor
The 5-HT3 (serotonin) receptor subtype is unique among known monoamine
receptors in that, rather than being a G-protein-coupled receptor, it forms a
ligand-gated ion channel. The subunit has structural and functional
similarities with nicotinic AChR, GABAergic and, other ligand gated ion channels
(1) and the receptor has therefore been modeled as homopentameric protein
complex with allosteric ligand binding sites. Heterologous expression in
Xenopus oocytes showed a fast 5-HT induced activation (<2ms) and
desensitization.
Fig. Activation of 5HT-3A receptor by serotonin (5HT;
5-hydroxytryptamine) and agonist chlorophenylbiguanide
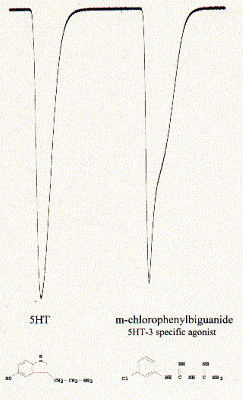
Note: downward currents reflect Na+ inward currents; the activity
profile of the current is specific for the two different agonists indicating
different activation/inactivation kinetics;
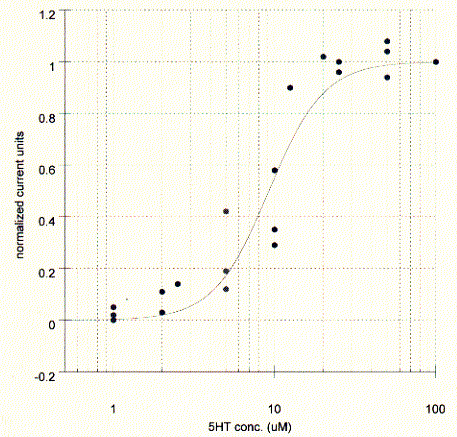
The elicited current is proportional to the agonist concentration and typical
dose response curves can be measured by plotting the peak current against the
agonist concentration. The affinity of the agonist for the binding site can be
established as the concentration where the peak current is half maximal. The
maximum current corresponds to the saturation level of the membrane, i.e, all
present channels are activated, while at the midpoint concentration only 50% of
all receptors are activated. The KD in this experiments is about
10mM for serotonin.
Fig. Serotonin dose response curve for 5HT-3A receptor in Xenopus
oocyte
The channel exhibited cation selectivity and a unitary conductance of
10-15pS. Current-voltage relationships did not show rectification in one report
(2), but strong inward rectification for potentials more negative than -50mV in
another report (3). The latter study estimates the single channel conductance at
0.4pS (from noise analysis of macroscopic courrents) which is about 20 to 100
fold lower than measured for other ligand gated receptor channels.
Fig. Inward currents in oocytes for NaCl, GuanidiniumCl, and CsCl
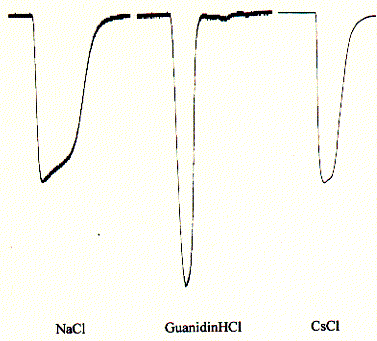
Note: the large peak for guanidinium chloride
indicates a preference for the quaternary ammonium ion guanidinium;
The 5HT-3A receptor is a cation selective channel (data not shown here) and
is also weakly selective against divalent cations like calcium. While 2mM
calcium reduces the current up to 50%, elevated (but physiologically
unimportant) 10mM CaCl2 reduce the inward current by 90%. Since intracellular
calcium concentrations are in the submicromolar range and extracellular
concnetration abotu 1.5mM, calcium blockade is physiologically not relevant.
Fig. Calcium block of 5HT-3A receptor in Xenopus oocytes
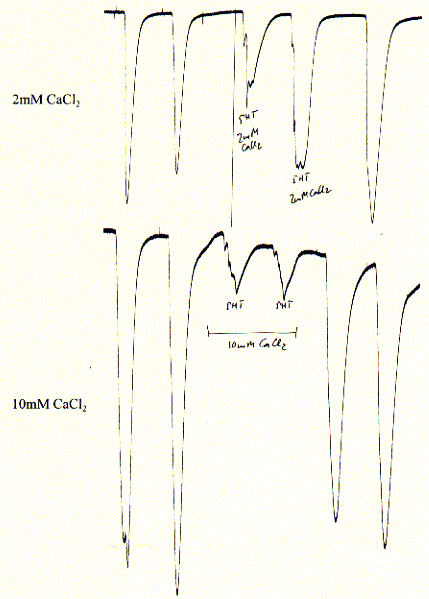
Note: experiments show two 5HT pulses before calcium addition
and two 5HT pulses after removal (wahsout) of calcium showing complete
restoration of initial activity and thus reversibility of blockade;
The affinities of 11 drugs for both dopamine D2 and 5-hydroxytryptamine3
(5-HT3) receptor sites were detd. in rat brain membranes. The 5 traditional
antiemetics (chlorpromazine, prochlorperazine, droperidol, fluphenazine, and
domperidone) displayed high affinity (<20 nM) for dopamine D2 receptors in
corpus striatum but were inactive at 5-HT3 receptors in the cortex. In contrast,
5 recently developed 5-HT3 antagonists (BRL 43694, ICS 205-930, zacopride, Lilly
278584, and MDL 72222) displayed nanomolar affinity for the 5-HT3 site but were
inactive (>10,000 nM) at the dopamine D2 receptor. Metoclopramide was unique
among these agents in that it was similarly potent at dopamine D2 (240 nM) and
5-HT3 (120 nM) receptors (11).
Fig. Inactivation of 5HT-3A receptor in Xenopus oocytes by the
specific antagonist ICS 205-930
Note: this antagonist has a very high affinity for the 5HT3 receptor and
does not wash out easily after administration; the slow and incomplete increase
of recovered currents is typical for these type of strong binding;
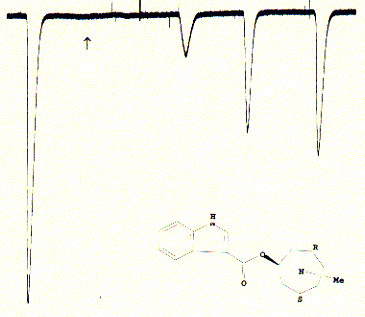
Single channel recordings in planar lipid bilayers
When channels or receptors can be isolated and purified, it is often possible
to reconstitute them into an synthetic membrane system which is composend of
phospholipids and only one type of protein. Such a system, similar to patch
clamp experiments on cell membranes (a much more sensitive current detection
method than the two electrod voltage clamp technique), allows to measure
currents through single ion channel units. The recordings obtained are called
single channel recordings.
Fig. Bilayer formation on glass micropipette tip and single channel
recording
Note: pipette tip is inserted twice in to the bath solution througha
lipid monolayer; during the two step procedure, a single bilayer forms across
the buffer filled tip of the glass opening (bottom); after inserting an ion
channel into the bilayer covering the pipette tip, current recordings like that
to the right can be observed; here, the current traces are continous and show
two levels; an upper level ( in top trace) corresponds to the open state of the
channel, while the lower level represents the closed channel; note that channel
open and closed times can vary substantially; channel open to closed transition
can occur in rapid succession;
These single channel recordings (one closed and one open level at any given
time during the recording) are due to the presence of only one active channel
unit. In the recording shown above, the open probability (time spent in the open
state divided by the total time of recording) is above 40%. If the membrane
would contain more than one active channel unit, it would be very likely to
observe occasional opening of a second level on top of the first open level.
Thus, the interpretation here is that the current shows the activity of a single
channel unit. From the recording it cannot be concluded how many inactive or
closed channel units are present in the same membrane.
Fig. Single channel analysis of current amplitude (left) and open
dwell time distribution (bottom)
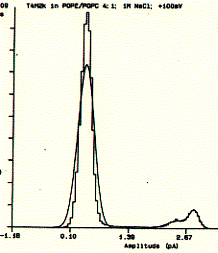
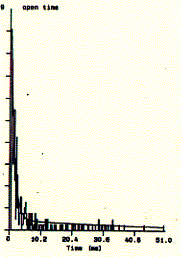
Note: left panel: large peak corresponds to closed level at 0.3pA and
small peak to open state at 2.6pA; right panel: open dwell time distribution in
milliseconds;
Note that spectroscopic studies are now used to demonstrate single molecule
activity of catalytic enzymes. The figure below shows a photocount single enzyme
recording of cholesterol oxidase. The figure below shows a real-time single
active site turnovers at a resolution of 13ms. There are clearly two levels
of photon counts in the trajectory toggling between the oxidized (higher photon
count) and reduced state of the the FAD coenzyme.
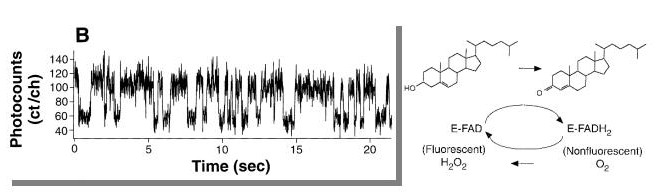
(Lu et al. Science. 1998 Dec 4;282(5395):1877-82).
back
to top